First, define “unusual.”
I used Dukascopy’s recorded EUR/USD bid and ask prices, reported sizes, and update times. EUR/USD is the dollar price of one euro; the midpoint is halfway between the quoted bid and ask.
The event rule combines three measurements and looks for unusual combinations relative to recent history. It does not require all three measurements to be large.
Quote imbalance
A signed summary of changes in recorded bid and ask prices and sizes. It describes changes in this quote feed; it does not identify executed buying, selling, or traders’ intentions.
Update count
The number of quote updates recorded during a second. This measures activity in the feed, not the total number of trades in the market.
Completed waiting time
The interval between successive updates, compared with a fitted expected interval. The full length becomes available only when the next update arrives. The fitted timing model failed calibration checks.
“Unusual” therefore means unusual under this specified rule. It is not a label for a proven market shock.
Start the clock
when the event is detectable.
The first qualifying second must end before the event can be identified. Its price movement is already observed at that point. The forecast concerns what happens afterward.
Already observed
Movement during the onset second, up to detection.
Still to happen
Movement over the next 300 seconds, measured from detection.
I300 = J + C300
The combined measurement spans the onset second plus the next 300 seconds. All changes are signed by onset-second quote imbalance, which need not match the direction of the initial price move. One pip = 0.0001 USD per EUR.
A small average can hide
a lot of movement.
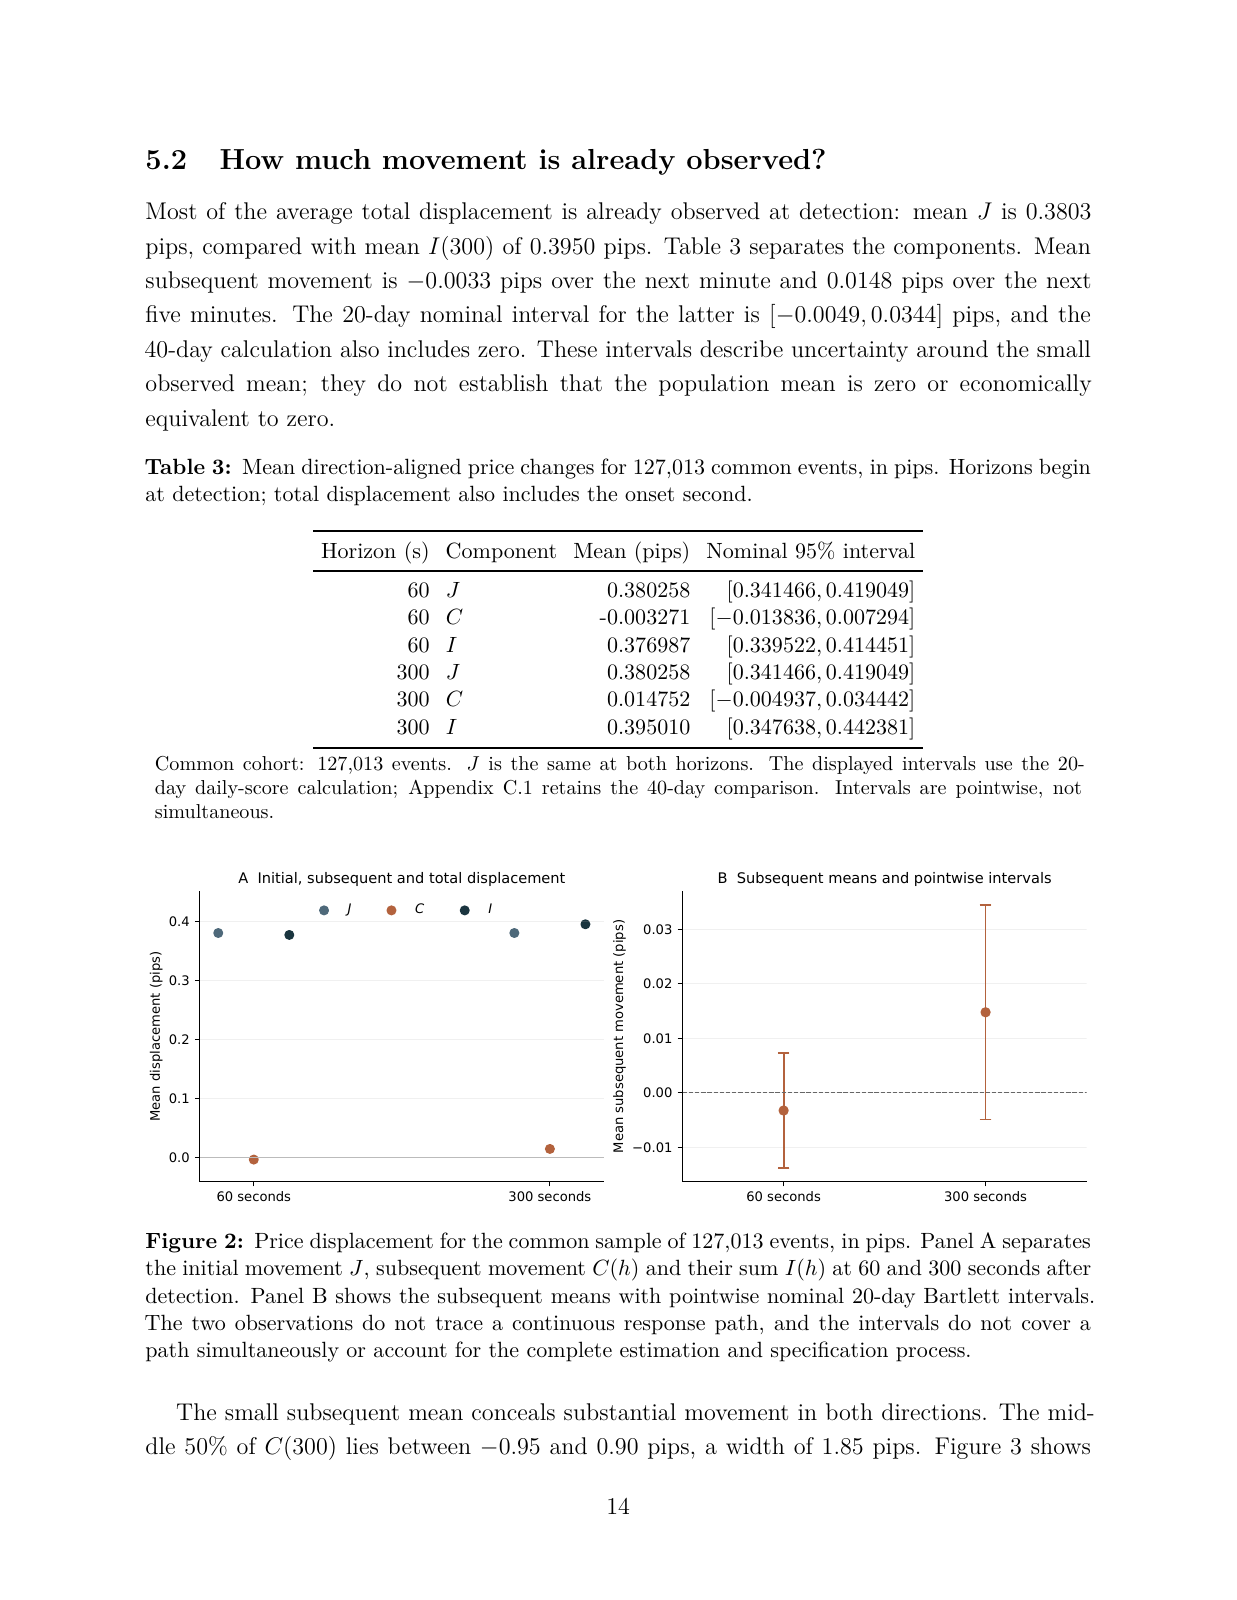
Across 127,013 common evaluated events from 6 May 2024 to 31 July 2026, average signed displacement was 0.380258 pips at detection. Adding the next five minutes brought it to 0.395010 pips.
0.380 pips
Mean signed displacement already recorded at detection.
127,013 common evaluated events. Direction is set by onset-second quote imbalance. The later mean adds 0.014752 pips to 0.380258 pips at detection. Rounded display; endpoint measurements, not a continuous price path.
The additional mean was 0.014752 pips. Individual outcomes were much more dispersed: the middle half of subsequent movements lay between −0.95 and +0.90 pips.
Three simpler event rules showed the same broad decomposition. This pattern does not establish that the more elaborate detector is superior.
Read it in the paper.
Three original pages, with a guide to what matters on each.
 Enlarge original page ↗
Page 14 · Table 3 & Figure 2
The two parts
of the average.
Table 3 separates movement already observed at detection from movement afterward. Figure 2 shows those components at 60 and 300 seconds.
These are endpoint summaries, not a continuous price path. The nominal pointwise intervals do not account for the complete estimation and specification process or establish that the population mean is exactly zero.
Open page 14 as an image ↗Does the extra information
improve a prediction?
I tested two original additions: combining imbalance magnitude with preceding price variation, and a statistic for agreement between adjacent imbalance signs, adjusted for sign composition. Each was compared with its own benchmark.
To evaluate forecasts I used mean squared error: square each prediction error, then average. Lower is better. A more elaborate model has to earn its place by reducing that error.
| Added feature and benchmark | Change |
|---|---|
| Imbalance magnitude × preceding price variation Against its original additive benchmark | +0.0144% |
| Adjacent-sign statistic Against its richer first-alert benchmark | +0.0027% |
| Supplementary interaction comparison Against the existing richer benchmark; after earlier results were inspected | +0.0160% |
Positive values mean higher error. These are separate paired comparisons, not a ranking of the features.
Neither original addition improved its benchmark. The supplementary interaction comparison also raised error. All four original fitted forecast models had higher pooled mean squared error than simply predicting no further movement.
These results concern the specified procedures in this sample. They do not prove that all currency-market prediction is impossible.
Where the claim stops.
The waiting-time model failed calibration checks. Its output cannot be treated as a validated shock probability. Recorded quotes also give only one view of the market; they are not a complete record of executed transactions.
The archive had already been inspected during development. Chronological forecasting controls the information used in a prediction, but it does not turn that research history into an untouched test sample.
The study has single-feed coverage gaps, retrospectively reconstructed observation support, and an assumption of zero processing latency. It does not establish a causal mechanism, permanent price impact, detector superiority, or executable trading returns.
The contribution is a specified event definition and a linked historical evaluation: what the rule selects, when the recorded price movement occurs, and how the stated forecasts perform.
Paper, code, and evidence.
Defining and Interpreting Unusual EUR/USD Quote Events.
Rignesh Padamanur · October 2026
The repository includes saved-result checks and figure reconstruction. Rebuilding the complete historical pipeline requires additional retained inputs; the public release is not a raw-data archive.